OpenObservatory: I've Been Listening to the Garden
A few months of tinkering with birds, bats and a Raspberry Pi, and now an illustrated e-ink display for the kitchen.
9 min read
I’ve been working on a project called OpenObservatory for the last few months. It started with me lying in a hammock, using Merlin Bird ID to work out what was singing in the garden, and thinking it’d be nice if something was doing that all the time. This is apparently what happens when you leave me alone in a hammock with a phone. I find a way to give myself more things to fiddle with :D
Merlin was the starting point because being able to put a name to something you can hear is lovely. There’s a whole lot going on outside that I either don’t notice or have no idea how to identify, and holding a phone up for a few minutes only tells you about those few minutes. I wanted to know what was happening when I wasn’t there listening. Early in the morning, overnight, or just while I was getting on with something else.
The result is a Raspberry Pi 5 and an AudioMoth USB microphone listening to the garden continuously. OpenObservatory keeps a record of the sounds it detects, tries to identify them, and keeps audio clips where appropriate so I can go back and listen. It all runs locally, which I’m pretty pleased about. Once it’s set up with the models it needs, the listening, identification and looking back through the results work without an internet connection.
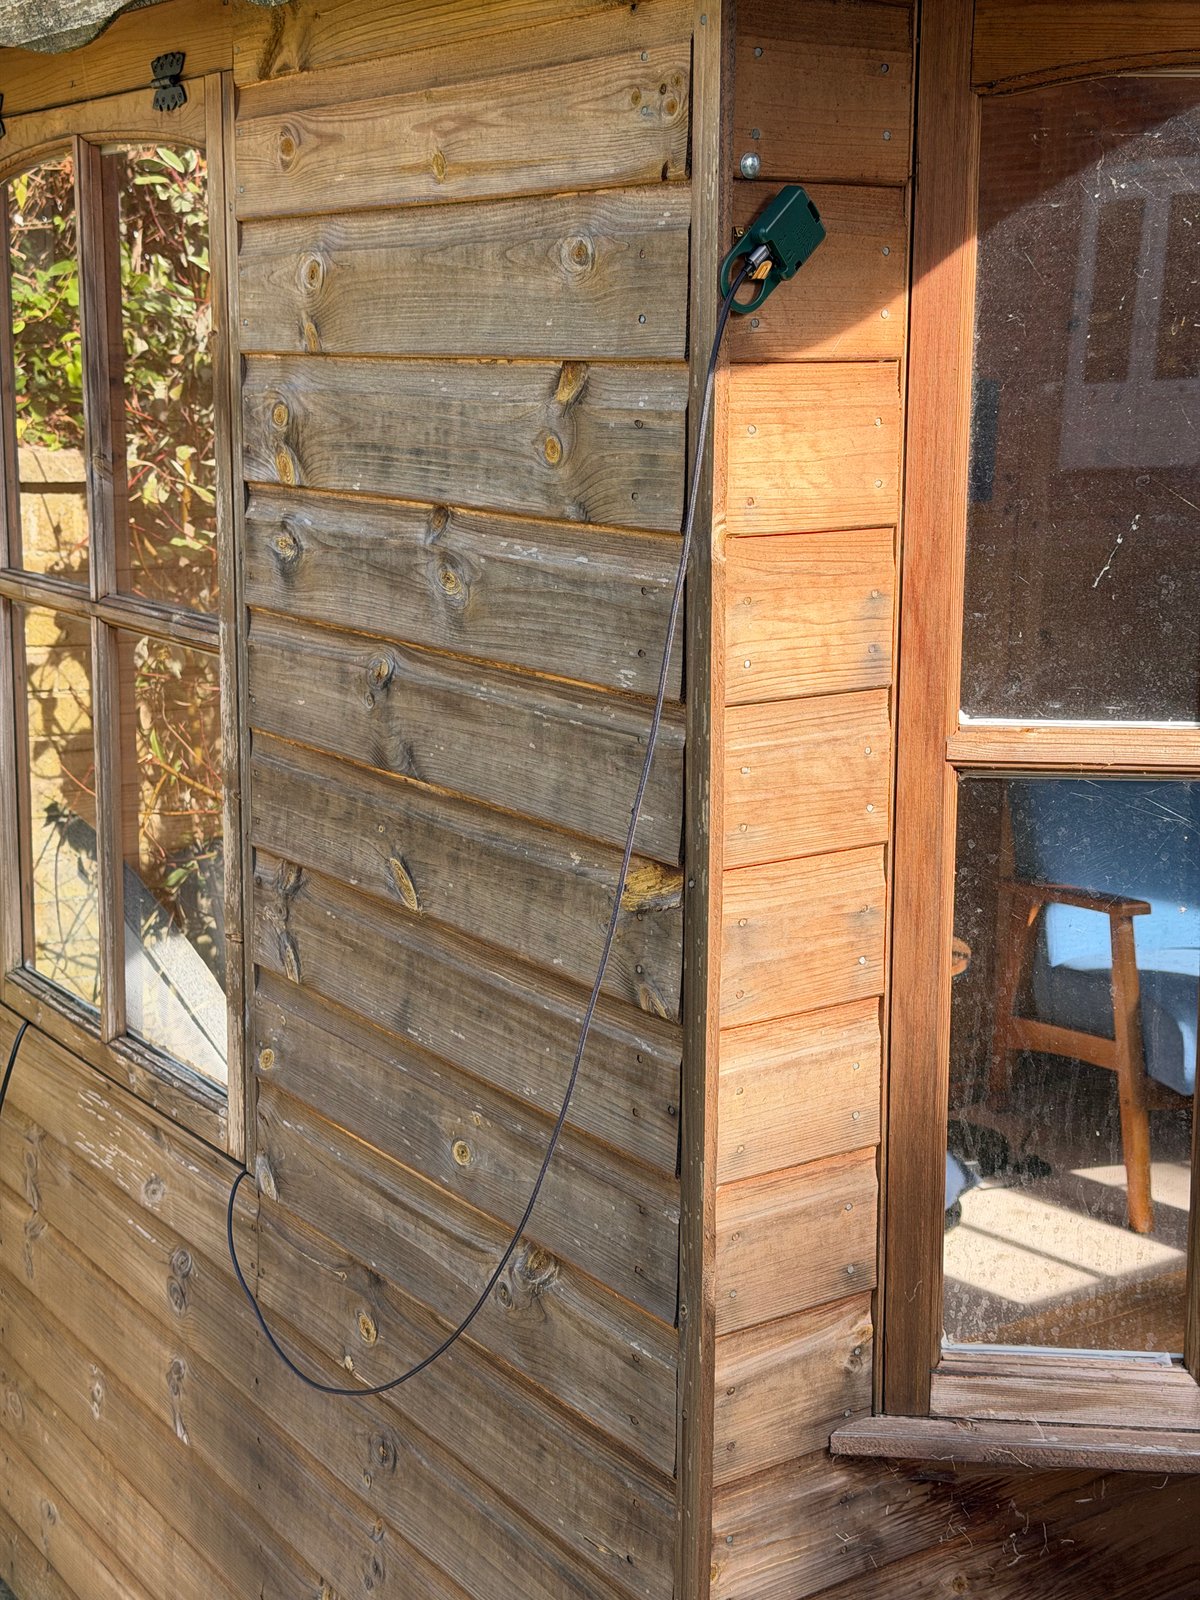
The microphone hanging on the summer house, getting on with the listening.
Bird identification uses BirdNET, so I should be clear that I haven’t spent the last few months teaching a neural network what a robin sounds like. There are people who have already done that work, and done it far better than I could. My bit has been putting the pieces together into something that can sit there unattended, keep useful evidence, and let me see what it’s been up to.
Then there are the bats. The microphone captures at 384 kHz, which gives it enough range to hear the ultrasonic calls as well as the birds. An ordinary audible stream is derived from the same recording, so both sides can work from one microphone. The live bat detector picks up passes and their frequencies; identifying an exact species from that is a much bigger claim, and the software is deliberately cautious about making it. Some of the labels have question marks. Those are there for a reason!
One of the bits I particularly like is being able to listen back to those calls. Obviously playing ultrasound through laptop speakers isn’t going to get you very far, so it can slow the recording down into our hearing range, or shift the frequency down in the way a handheld bat detector does. You can see which treatment you’re listening to, and the original recording is still there. There’s something very pleasing about getting access to a bit of the garden that’s normally completely inaudible to me.
The browser view has the live detections and those scrolling spectrograms that I could probably spend far too long watching. It also lets me go back through last night, the dawn chorus, or previous days, and open a detection to inspect it. Further out, there are views of when the bats are active relative to sunset, how the birds’ activity changes with the daylight, and which species are being heard over the weeks. That’s where leaving it running starts to become interesting.
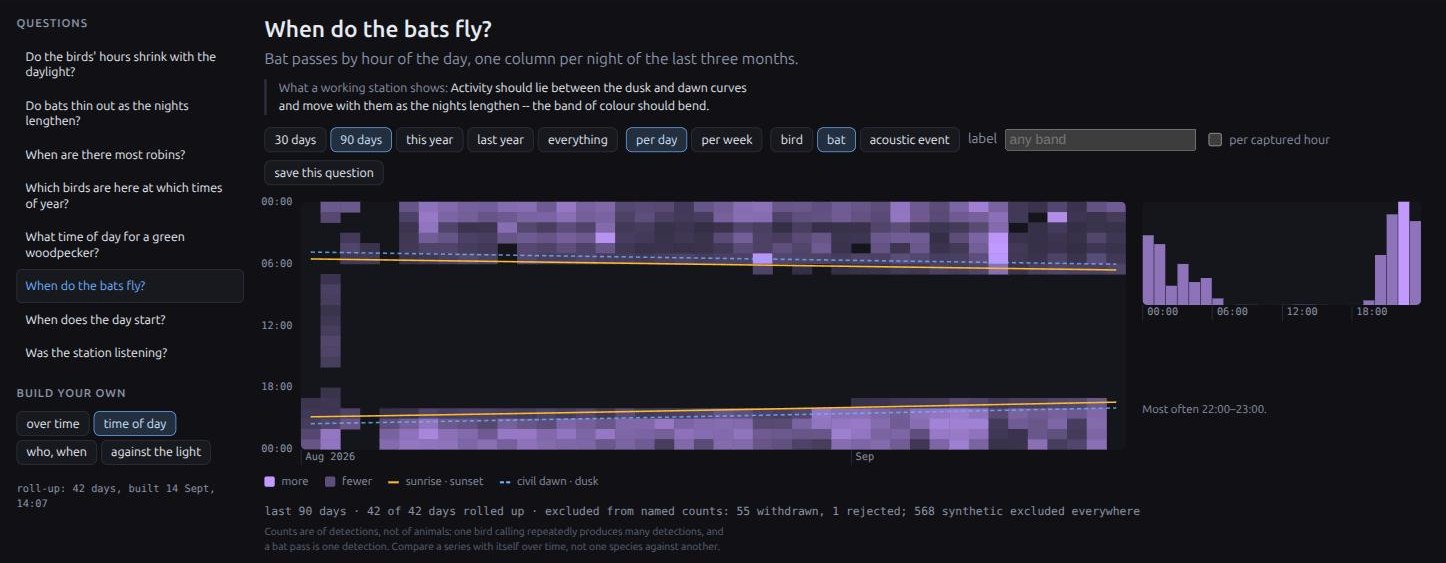
When do the bats fly? Each column is a night, with the detections plotted against sunrise, sunset, dawn and dusk. You can see the evening activity shifting earlier as the nights get longer.
I’ve got fairly fussy about what the numbers actually mean. A bird making a noise repeatedly can create lots of detections. There’s an example in the project’s history screenshot with 486 woodpigeon detections in one day, which would be a fairly alarming number of woodpigeons if you read it as a headcount. So the counts are labelled as detections. Likewise, if the microphone wasn’t recording for an hour, that needs to show up as a gap. Otherwise it’s very easy to produce a convincing chart of absolutely nothing.
You can review the identifications, reject them, correct them, and keep a recording you particularly want to hang onto. I want to be able to get from a name on a screen back to the sound that caused it to appear. The project README has screenshots of all this if you fancy a poke around; there’s quite a lot in there now.
Of course, a browser full of graphs is mostly useful when I’m actively poking at it. I already had a little ESP32 touchscreen in the house showing recent identifications, so you could see what the station was hearing without opening anything. It also has an optional Home Assistant integration over MQTT, because apparently I am constitutionally incapable of building something without considering how to plug it into the rest of the house.
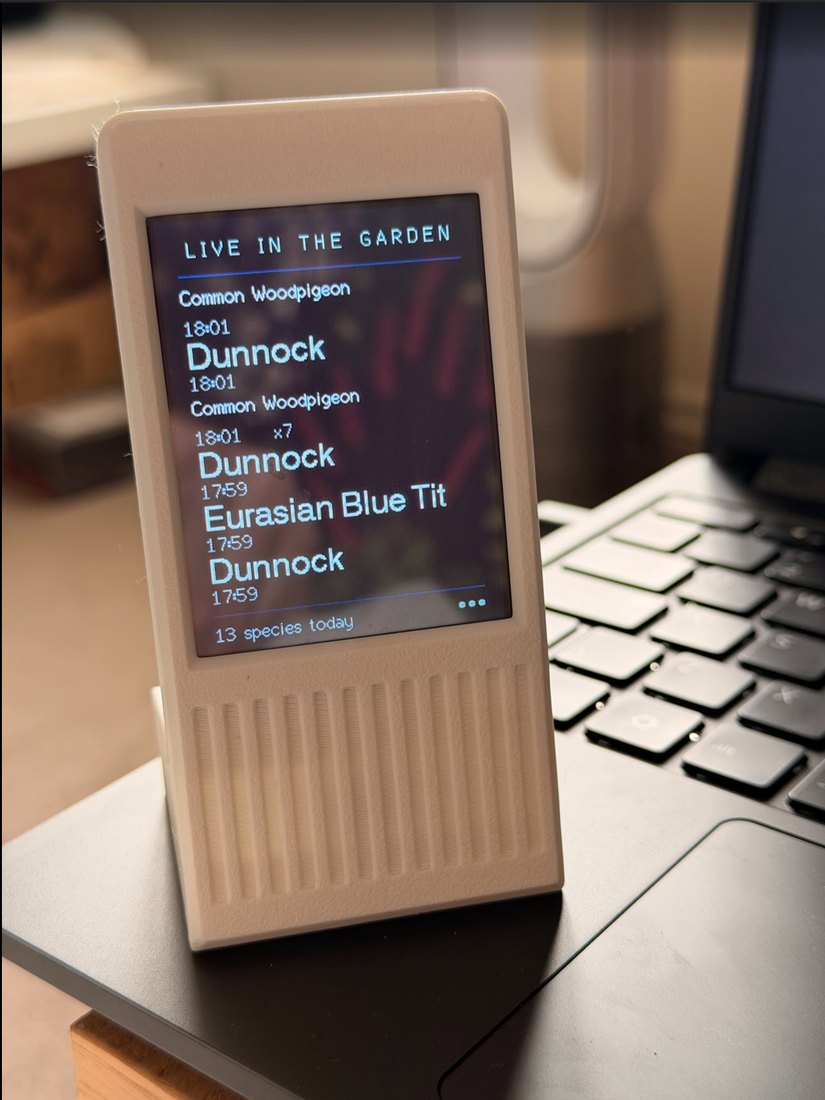
The original little ESP32 LCD display. A quick look at what the garden’s been up to, without opening the browser.
I should probably mention at this point that I love e-ink. I’ve got quite a lot of TRMNL devices, small and large, dotted about the house already. I really like having a bit of information sitting there that you can glance at whenever it’s useful. Finding another excuse to have an e-ink display was never going to be particularly difficult.
As an aside, my wife asked me to build a Japanese vocabulary flashcard app for one of the TRMNLs to help with her Japanese learning. She loves it, which makes me very happy. That’s a project I should write about properly in another blog, but it gives you an idea of the sort of thing these displays get used for around here :D
The latest addition is Garden Ink, and this is the bit that prompted me to finally write about OpenObservatory. I saw Fugleramme on Hacker News, an e-ink bird frame by arnegiacomo, and thought an e-ink version of my existing display would be rather nice. Credit where it’s due, seeing that project is what sent me down this particular rabbit hole.

Garden Ink uses a Raspberry Pi Zero and a 7.3-inch Waveshare Spectra 6 colour e-ink display, mounted vertically. It takes its data from the existing OpenObservatory station. The listening and identification still happen outside; this is a seperate device that asks the station what it’s heard and turns the answer into something nice to have on the kitchen counter.
It updates roughly once an hour, with an illustration of the latest qualifying identification from the last hour and four other frequently heard species from today. The birds on it are illustrations of what the microphone identified, so there’s no camera involved. It shows when things were heard and the date. I left a clock off it, because a clock on an hourly refresh would spend most of its time being wrong, which feels like a fairly fundamental problem for a clock.
I like the pace of it. For this particular job an occasional update is plenty, and the pictures make it something you can glance at as you go past. If I want to investigate a sound or watch what’s happening live, the other displays are still there. This one can get on with showing me birds while I’m in the kitchen.
There’s a printed enclosure as well, called Counterframe. Four parts, printed in PLA, that go together without screws: the front, an internal carrier, the back and the stand. The Pi and display electronics fit inside, with one power lead coming out. The OpenSCAD files and printable parts are in the repo. I do enjoy the point where a collection of boards and cables becomes an actual object you can put somewhere.
The artwork still needs some fiddling. There are 47 illustrations bundled with it at the moment, and I’m working towards a more consistent ink-and-wash style based on the original robin image. There’s a little artwork studio for generating, reviewing and exporting them. Generating more images is optional and paid; the display runs with the pictures it already has, so it doesn’t need an OpenAI key just to sit there showing you a bird.
On the subject of AI, nearly all of OpenObservatory’s implementation code was AI-authored under my direction. I’ve been doing the product thinking, architecture, hardware choices, reviewing and correcting, with AI doing most of the Python, TypeScript, firmware and tests. I’ve put that in the main repo because I think it’s useful context for anyone looking through it. There is a lot of documentation about what was checked and what hasn’t been checked yet, partly because something looking plausible has repeatedly turned out to be an insufficient standard of proof.
There’s still plenty I’d like to improve on Garden Ink: the artwork, readability, refresh behaviour and power consumption for a start. E-ink doesn’t magically make the Pi behind it stop using power, and I haven’t measured the whole device properly yet. It’s an assembled, working thing on the counter, with more tinkering ahead of it. Which is probaby a reasonably accurate description of most of my home projects 😅
Both repositories are public if you’d like to have a look or build something similar: OpenObservatory is the listening station, and Garden Ink is the new display. You need the station for the display to have anything to report, though you can try the display’s preview on a computer without buying the hardware. I’m enjoying having a way to notice more of what’s already going on out there. The garden was doing all this anyway, I’ve just finally given myself a way to pay attention.